Our research group has broad interests in transportation field. Currently, the team focuses on the development of Artificial Intelligence (AI) and machine learning solutions for advancing traffic operations; performing big data analytics for transportation systems and smart cities; leveraging emerging technologies and methodologies to tackle transportation safety challenges; and innovating computational modeling & simulation for rapidly evolving transportation systems. Below are some illustrations of work we have recently performed. We would love to work with different groups and organizations to collaboratively address different transportation challenges.
Shared Mobility
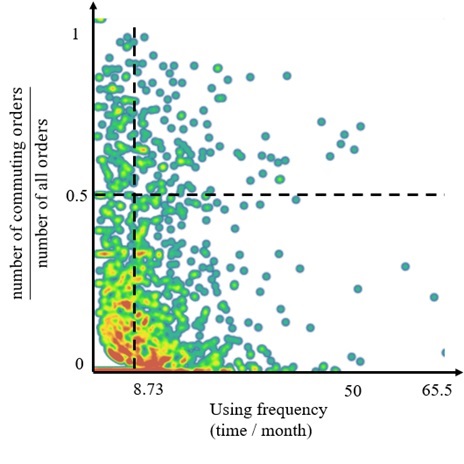
Who Use Carsharing for Commuting?
Source: J. Ye, D. Wang, H. Zhang, and H. Yang (2019). What Kind of People Use Carsharing for Commuting? A Case Study in Shanghai. Transportation Research Record: Journal of Transportation Research Board. <Accepted: 02/01/19>.
Abstract : Carsharing as a service has been growing rapidly worldwide. Its booming has drawn wide attention in research community in regard to the underlying driven factors and the user characteristics. Despite the extensive investigations, there are still limited studies focusing on the examination of the users using carsharing as a commuting mode. Questions such as what kind of people would like to use carsharing for commuting and why they frequently use carsharing to commute are not clear. To enrich our understanding of such questions, this paper aims to investigate the carsharing commuters in a mega city. Specifically, it intends to integrate the actual user order data with survey data from 1,920 participants to uncover the characteristics of carsharing commuters. Data from the Evcard carsharing systems in Shanghai were explicitly analyzed. Through the descriptive analysis and logistic regression models, the characteristics and critical factors that affect the choice of carsharing as a commuting mode were captured. The results show that 1) carsharing commuters mostly live or work in suburban areas where public transport accessibility is limited; 2) carsharing commuters are more likely to be highly educated, in a higher income bracket, and older than other carsharing members; 3) high-frequency carsharing commuters own less private cars; and 4) those high-frequency carsharing commuters with higher income are less sensitive to the carsharing costs caused by congestion. The findings in the study offer some insights into the carsharing commuters and provide some supportive information when considering policies in developing carsharing systems in urban areas.
Location & Time Matter: Taxi or E-Hailing?
Source: C. Xu, J. Gao, F. Zuo, K. Ozbay, H. Yang, and H. Cui (2019). Understanding Spatial-Temporal Impacts on Mode Preference between Taxi and E-Hailing Service. Transportation Research Board 98th Annual Meeting, Washington D. C., January 13-17, 2019.
Abstract : The aim of this paper is to examine the impact of spatial and temporal factors on the preference between regular taxi and ridesourcing service. The pickup and drop-off data of both regular taxis and Didi chuxing ridesourcing vehicles in Chengdu, China on November 2016 were used. Spatial analysis was applied to measure spatial autocorrelation for taxi and Didi pickups and drop-offs, while mixed logit models were established to investigate the impact of both spatial and temporal factors. The results suggest that although taxi and ridesourcing share some hot spots, ridesourcing vehicles are more active at the outer areas of the city where taxis are less available. Moreover, the mixed logit modes indicated that the ridesourcing was preferred in the morning peak, while taxi was preferred at late night. While ridesourcing vehicles’ preferred points of interest (POI) included bars and residential areas, taxis’ preferred POI included railway stations, tourist attractions and university campuses. The preferred mode difference between pickup and drop-off were also observed which indicates that riders were loyal to one mode. The findings provided new insights based on real trip data to understand the relationship between taxi and ridesourcing services in China.
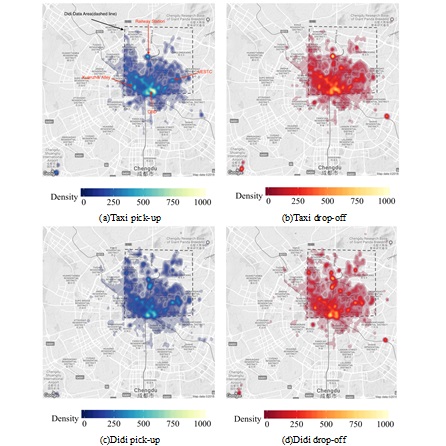
How Taxis Drive in the Era of Ridesourcing?
Source: Q. Ma, H. Yang, H. Zhang, K. Xie, and Z. Wang (2019). Modeling and Analysis of the Daily Driving Patterns of Taxis in a Reshuffled Ride-hailing Service Market. Journal of Transportation Engineering, Part A: Systems. <In Press>
Abstract : This paper aims to model and analyze the changes in daily driving patterns of taxis in a disrupted market due to the booming of e-hailing services. This is accomplished by mining large-scale trajectory datasets obtained from a major taxi company in Shanghai. The taxi dataset includes more than 0.8 billion trajectory points associated with over 12,000 taxis obtained in a period of ten days (five continuous weekdays in 2012 and 2016, respectively). The raw data were efficiently processed with the acceleration of high performance computing. Creatively, the concept of information entropy and principal component analysis were adopted to spatially delineate the gridded daily taxi driving trajectories. This helps describe the disordered taxi traces in comparable profiles across different spatial zones. Then, distinct patterns were extracted using the k-means clustering method. The proposed analysis pipeline has built a stable way of comparing driving patterns between different time periods after relaxing the concern about the potential spreading of demands over time. By comparing statistical features associated with the identified clusters, the changes of the daily taxi driving patterns in the context of the widely popularization of e-hailing services were quantitatively unveiled. This will be informative for taxi service providers revamping their business models when facing the opportunities brought by e-hailing apps and the competitions of other ride-sourcing vehicles in urban areas.
Traffic Safety
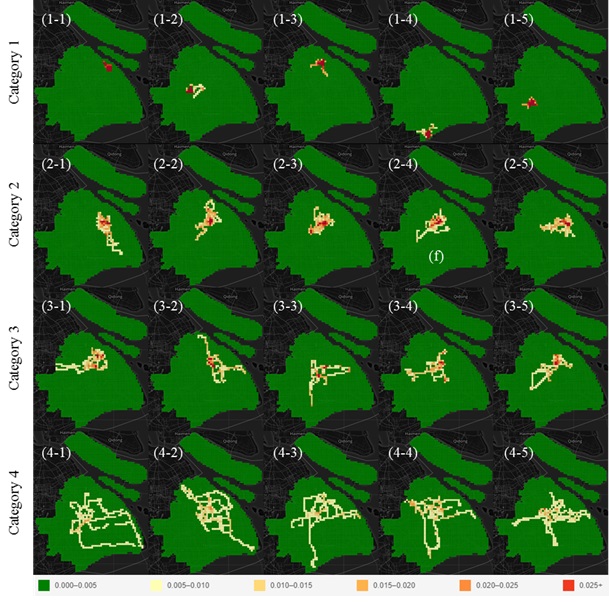
How Unstable Speed Affect Road Safety?
Source: C. Xu, X. Wang, H. Yang, K. Xie, and X. Chen (2019).Exploring the Impacts of Speed Variances on Safety Performance of Urban Elevated Expressways using GPS Data. Accident Analysis and Prevention, Vol. 123, February 2019, pp. 29–38, DOI: 10.1016/j.aap.2018.11.012.
Abstract : Speed variation on urban expressways has been frequently noted as a key factor associated with high crash risk. However, it was often difficult to capture the safety impact of speed variance with spaced sensor measurements. As an alternative, this paper aims to leverage the use of the floating car data (FCD) to capture the speed variance in a morning rush hour on urban elevated expressways and examine its effect on safety. A semi-automatic filtering process was introduced to distinguish taxi GPS data points on the elevated expressways from the ones on the surface roads under the expressways. Subsequently, the standard deviation of the cross-sectional speed mean (SDCSM) and the cross-section speed standard deviation (MCSSD) were derived to capture the spatial and temporal speed variances, respectively. Together with other explanatory variables, both hierarchical and non-hierarchical Poisson-gamma measurement error models were developed to model the crash frequencies of the expressways. The modeling results showed that the hierarchical model performed better and both SDCSM and MCSSD were found to be positively related to the crash occurrence. This secures the need for addressing the impact of speed variation when modeling crashes occurred on the elevated expressways.
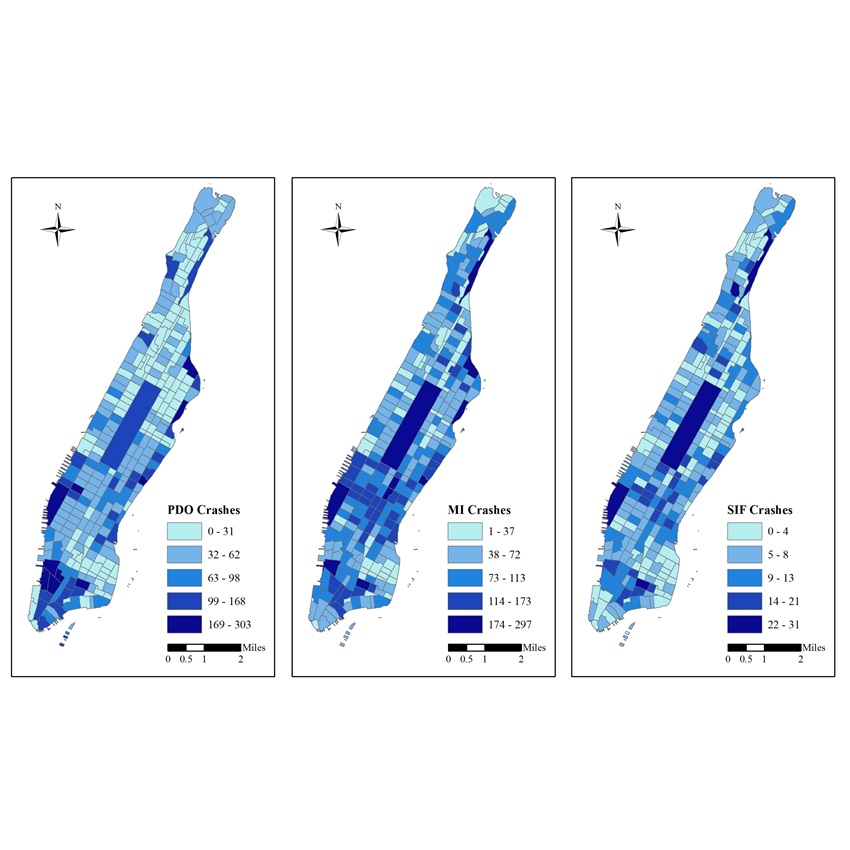
Can We Account for Spatial Autocorrelation among Crashes?
Source: K. Xie, K. Ozbay, H. Yang, D. Yang (2018). A New Methodology for Before-After Safety Assessment Using Survival Analysis and Longitudinal Data. Risk Analysis: An International Journal. DOI: 10.1111/risa.13251.
Abstract : The widely used empirical Bayes (EB) and full Bayes (FB) methods for before–after safety assessment are sometimes limited because of the extensive data needs from additional reference sites. To address this issue, this study proposes a novel before–after safety evaluation methodology based on survival analysis and longitudinal data as an alternative to the EB/FB method. A Bayesian survival analysis (SARE) model with a random effect term to address the unobserved heterogeneity across sites is developed. The proposed survival analysis method is validated through a simulation study before its application. Subsequently, the SARE model is developed in a case study to evaluate the safety effectiveness of a recent red light-running photo enforcement program in New Jersey. As demonstrated in the simulation and the case study, the survival analysis can provide valid estimates using only data from treated sites, and thus its results will not be affected by the selection of defective or insufficient reference sites. In addition, the proposed approach can take into account the censored data generated due to the transition from the before period to the after period, which has not been previously explored in the literature. Using individual crashes as units of analysis, survival analysis can incorporate longitudinal covariates such as the traffic volume and weather variation, and thus can explicitly account for the potential temporal heterogeneity.
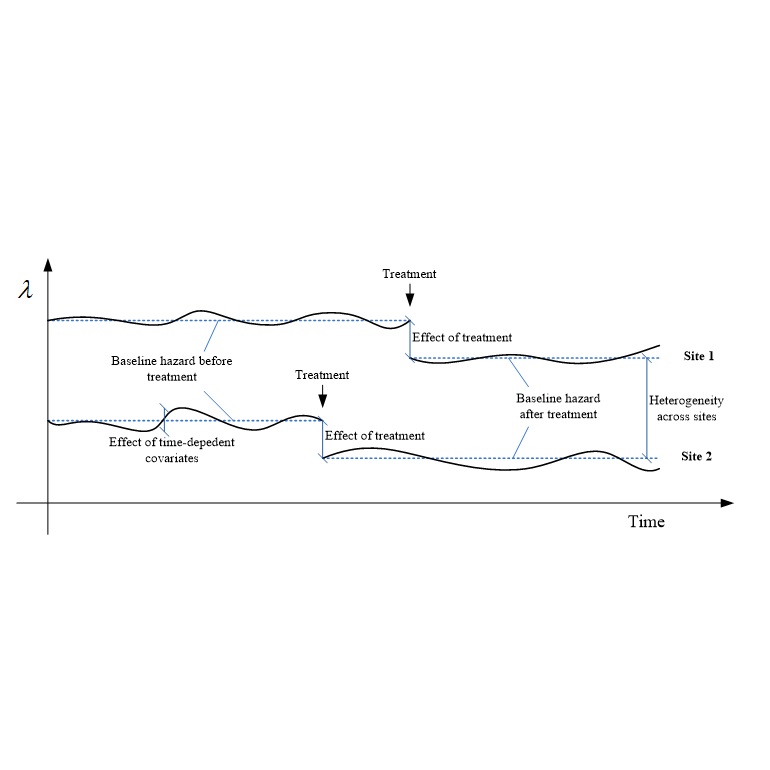
Thinking about Before/After Safety Evaluation?
Source: K. Xie, K. Ozbay, H. Yang, D. Yang (2018). A New Methodology for Before-After Safety Assessment Using Survival Analysis and Longitudinal Data. Risk Analysis: An International Journal. DOI: 10.1111/risa.13251.
Abstract : The widely used empirical Bayes (EB) and full Bayes (FB) methods for before–after safety assessment are sometimes limited because of the extensive data needs from additional reference sites. To address this issue, this study proposes a novel before–after safety evaluation methodology based on survival analysis and longitudinal data as an alternative to the EB/FB method. A Bayesian survival analysis (SARE) model with a random effect term to address the unobserved heterogeneity across sites is developed. The proposed survival analysis method is validated through a simulation study before its application. Subsequently, the SARE model is developed in a case study to evaluate the safety effectiveness of a recent red light-running photo enforcement program in New Jersey. As demonstrated in the simulation and the case study, the survival analysis can provide valid estimates using only data from treated sites, and thus its results will not be affected by the selection of defective or insufficient reference sites. In addition, the proposed approach can take into account the censored data generated due to the transition from the before period to the after period, which has not been previously explored in the literature. Using individual crashes as units of analysis, survival analysis can incorporate longitudinal covariates such as the traffic volume and weather variation, and thus can explicitly account for the potential temporal heterogeneity.
Do You Often See Secondary Crashes on Highways?
Source: H. Yang, Z. Wang, K. Xie, K. Ozbay, and M. Imprialou (2018). Methodological Evolution and Frontiers of Identifying, Modeling and Preventing Secondary Crashes on Highways. Accident Analysis and Prevention, Vol. 117, August 2018, pp. 40–54, DOI: 10.1016/j.aap.2018.04.001
Abstract : Secondary crashes (SCs) or crashes that occur within the boundaries of the impact area of prior, primary crashes are one of the incident types that frequently affect highway traffic operations and safety. Existing studies have made great efforts to explore the underlying mechanisms of SCs and relevant methodologies have been evolving over the last two decades concerning the identification, modeling, and prevention of these crashes. So far there is a lack of a detailed examination on the progress, lessons, and potential opportunities regarding existing achievements in SC-related studies. This paper provides a comprehensive investigation of the state-of-the-art approaches; examines their strengths and weaknesses; and provides guidance in exploiting new directions in SC-related research. It aims to support researchers and practitioners in understanding well-established approaches so as to further explore the frontiers. Published studies focused on SCs since 1997 have been identified, reviewed, and summarized. Key issues concentrated on the following aspects are discussed: (i) static/dynamic approaches to identify SCs; (ii) parametric/non-parametric models to analyze SC risk, and (iii) deployable countermeasures to prevent SCs. Based on the examined issues, needs, and challenges, this paper further provides insights into potential opportunities such as: (a) fusing data from multiple sources for SC identification, (b) using advanced learning algorithms for real-time SC analysis, and (c) deploying connected vehicles for SC prevention in future research. This paper contributes to the research community by providing a one-stop reference for research on secondary crashes.
AI & Machine Learning
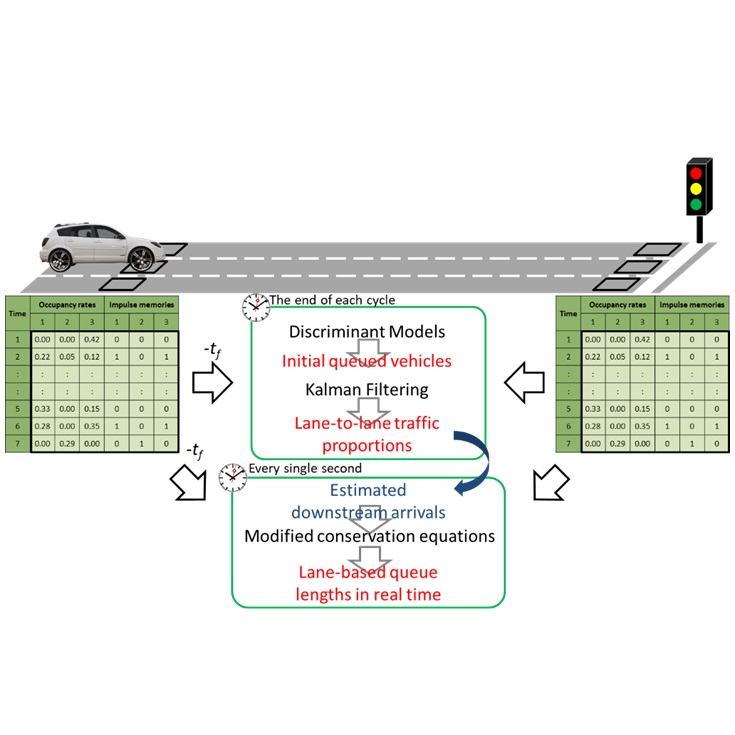
Predicting the Number of Vehicle Arrivals at Intersections?
Source: S. Lee, K. Xie, D. Ngoduy, M. Keyvan-Ekbatani, and H. Yang (2018). A Lane-based Predictive Model of Downstream Arrival Rates in a Queue Estimation Model Using a Long Short-term Memory Network. Transportation Research Procedia, Vol. 34, pp. 163-170.
Abstract : In this study, we develop a mathematical framework to predict cycle-based queued vehicles at each individual lane using a deep learning method – the long short-term memory (LSTM) network. The key challenges are to decide the existence of residual queued vehicles at the end of each cycle, and to predict the lane-based downstream arrivals to calculate vertical queue lengths at individual lanes using an integrated deep learning method. The primary contribution of the proposed method is to enhance the predictive accuracy of lane-based queue lengths in the future cycles using the historical queuing patterns. A major advantage of implementing an integrated deep learning process compared to the previously Kalman-filter-based queue estimation approach is that there is no need to calibrate the co-variance matrix and tune the gain values (parameters) of the estimator. In the simulation results, the proposed method perform better in only straight movements and a shared lane with left turning movements.
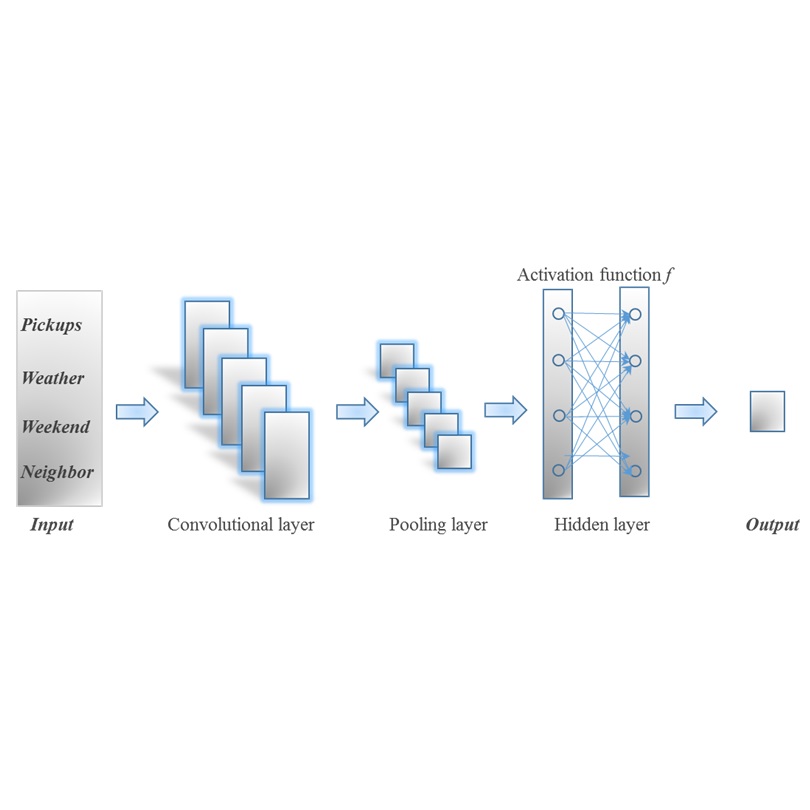
Predicting Daily Usage of Bike Sharing Systems?
Source: H. Yang, K. Xie, K. Ozbay, Y. Ma, and Z. Wang (2018). Use of Deep Learning to Predict Daily Usage of Bike Sharing Systems. Transportation Research Record: Journal of Transportation Research Board, DOI: 10.1177/0361198118801354.
Abstract : The use of bikes among stations is often spatiotemporally imbalanced, causing many problems in daily operations. Predictively knowing how the system demand evolves in advance helps improve the preparedness of operational schemes. This paper aims to present a predictive modeling approach to analyze the use of bicycles in bike sharing systems. Specifically, a deep learning approach using the convolutional neural networks (CNN) was proposed to predict the daily bicycle pickups at both city and station levels. A numerical study using data from the Citi Bike System in New York City was performed to assess the performance of the proposed approach. Other than the historical records, relevant information like weather was also incorporated in the modeling process. The modeling results show that the proposed approach can achieve improved predictive performance in both city- and station-level analyses, confirming the merits of the proposed method against other baseline approaches. In addition, including information of neighboring stations into the models can help improve the performance in station-level prediction. The predictive performance of the CNN was also found to be related to parameters such as temporal window, number of neighboring stations, learning ratio, patch size, and inclusion of addition data such as drop-offs. Thus, the implementation of the proposed models requires necessary calibration to determine appropriate parameters for a given bike sharing system.
Resilience
Are Our Transportation Networks Resilient in Hurricanes?
Source: Y. Zhu, K. Xie, K. Ozbay, F. Zuo, and H. Yang (2017). Data-Driven Spatial Modeling for Quantifying Network-Wide Resilience in the Aftermath of Hurricanes Irene and Sandy. Transportation Research Record: Journal of Transportation Research Board, No. 2604, pp. 9–18, DOI: 10.3141/2604-02.
Abstract : In recent years, the New York City metropolitan area was hit by two major hurricanes, Irene and Sandy. These extreme weather events disrupted and devastated the transportation infrastructure, including road and subway networks. As an extension of the authors’ recent research on this topic, this study explored the spatial patterns of infrastructure resilience in New York City with the use of taxi and subway ridership data. Neighborhood tabulation areas were used as the units of analysis. The recovery curve of each neighborhood tabulation area was modeled with the logistic function to quantify the resilience of road and subway systems. Moran's I tests confirmed the spatial correlation of recovery patterns for taxi and subway ridership. To account for this spatial correlation, citywide spatial models were estimated and found to outperform linear models. Factors such as the percentage of area influenced by storm surges, the distance to the coast, and the average elevation are found to affect the infrastructure resilience. The findings in this study provide insights into the vulnerability of transportation networks and can be used for more efficient emergency planning and management.
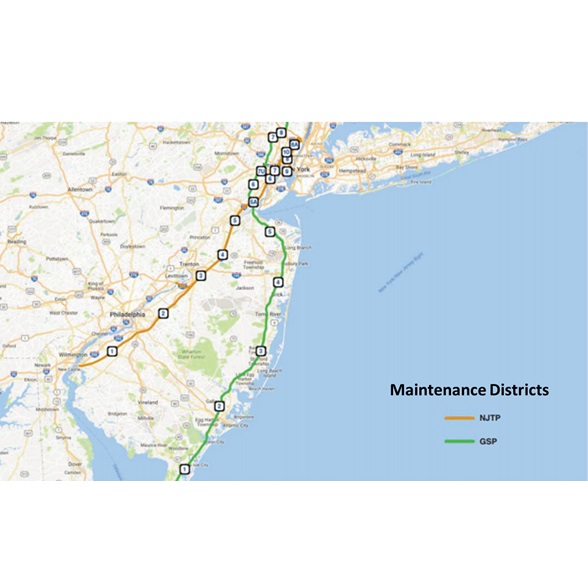
Having Enough Salt to Maintain Highways in Snowstorms?
Source: K. Xie, K. Ozbay, Y. Zhu, S. Demiroluk, H. Yang, and H. Nassif (2017). Modeling the Salt Usage During Snow Storms: An Application of Hierarchical Linear Models with Varying Dispersion. Transportation Research Record: Journal of Transportation Research Board, No. 2643, pp. 54–64, DOI: 10.3141/2643-07.
Abstract : Snow can cause dangerous driving conditions by reducing pavement friction and covering road surface markings. Salt is widely used by highway maintenance managers in the United States to reduce the impact of snow or ice on traffic. For the development of long-term plans, especially for the next winter season, it is essential to know what factors affect salt usage and to determine the sufficient amount of salt needed in each depot location. This determination can be accomplished by estimating statistically robust models for salt usage prediction. In this study, historical data regarding storm characteristics and salt usage on the New Jersey Turnpike and Garden State Parkway were used to estimate those models. Linear models, hierarchical linear models, and hierarchical linear models with varying dispersion (HLVDs) were developed to predict the salt usage on the two highways. Results show that districts with higher average snow depth, longer storm duration, and lower average temperature were associated with greater salt usage. HLVD models were found to have the best predictive performance by including random parameters to account for unobserved spatial heterogeneity and by including fixed effects in the dispersion term. In addition, with the estimation of case-specific dispersion on the basis of storm characteristics, HLVD models could be used appropriately to estimate the upper bounds of salt usage, bounds that are not extremely large and could satisfy the salt demand in most cases. The findings of this study can provide highway authorities with valuable insights into the use of statistical models for more efficient inventory management of salt and other maintenance materials.
Modeling & Simulation
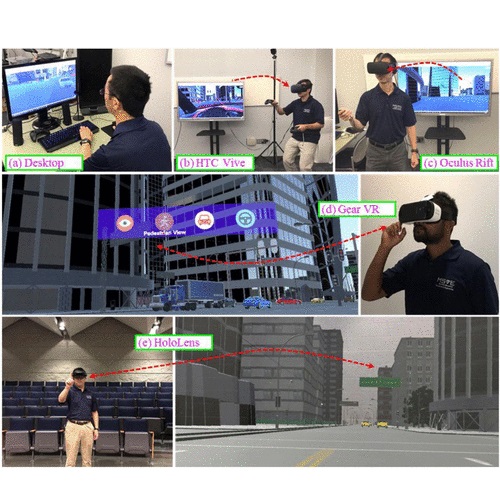
Can VR/AR Enhance the Visualization of Traffic Simulation?
Source: H. Yang, Y. Shen, M. Hasan, D. Perez, J. Shull (2018). Framework for Interactive M3 Visualization of Microscopic Traffic Simulation. Transportation Research Record: Journal of Transportation Research Board, DOI: 10.1177/0361198118787088. (Practice-Ready Paper, TRB Standing Committee on Visualization in Transportation, ABJ95).
Abstract : Full comprehension of microscopic traffic simulation (MTS) models has necessitated the development of proper visualizations. Existing MTS models only provide limited capability of two- and/or three-dimensional displays that often restrict users’ viewpoint to a flat screen. Their downscaled scenes neither provide a realistic representation of the environment nor allow different users to simultaneously experience the simulation model from different perspectives. This largely prevents analysts from effectively demonstrating and disseminating their simulation results to various stakeholders of different background and knowledge. In light of these issues, this paper aims to develop a framework that enables a multi-user, multi-perspective, and multi-mode (M3) visualization architecture for microscopic traffic simulation. The proposed framework is empowered by the latest advances in cloud computing and virtual reality (VR) to support interactive and immersive visualization for simulated traffic environments. A client-server architecture allows multiple users at distributed physical locations to view the same simulation from multiple perspectives simultaneously and supports a variety of virtual/augmented reality devices. A prototype of the proposed M3 visualization framework is implemented and demonstrated by simulating and visualizing a model of typical traffic operations in a high-density urban area. The promising capability of the M3 visualization framework is attested. Potential improvements over the present study to further excel current visualization framework are also discussed.
Connected/Autonomous Vehicles
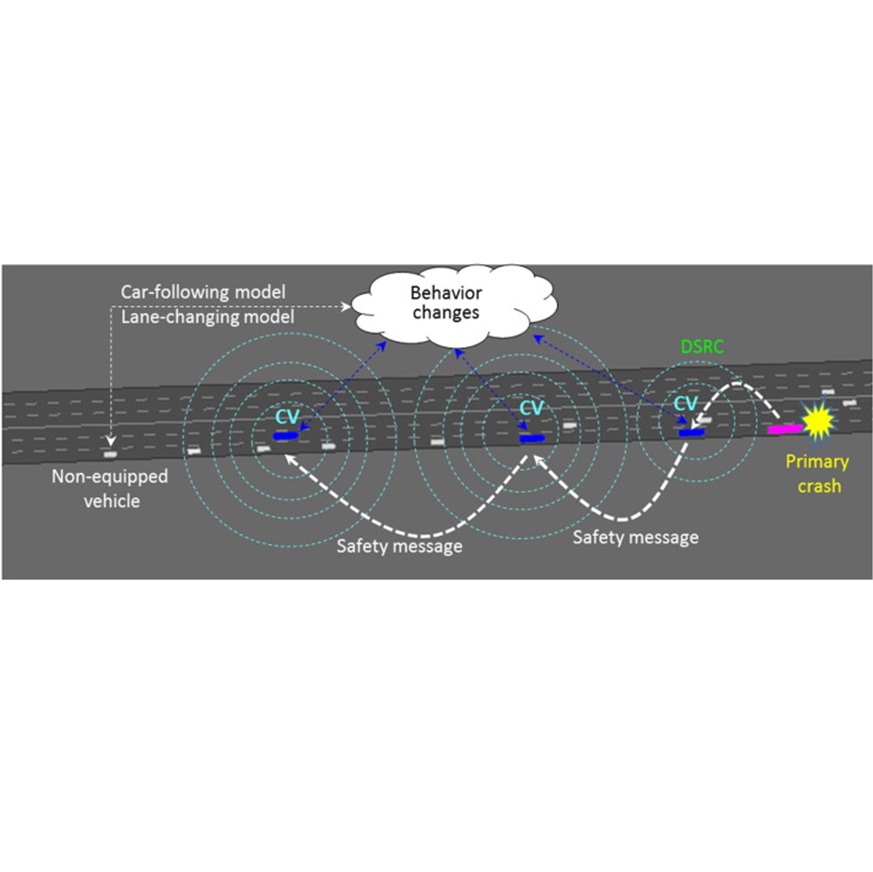
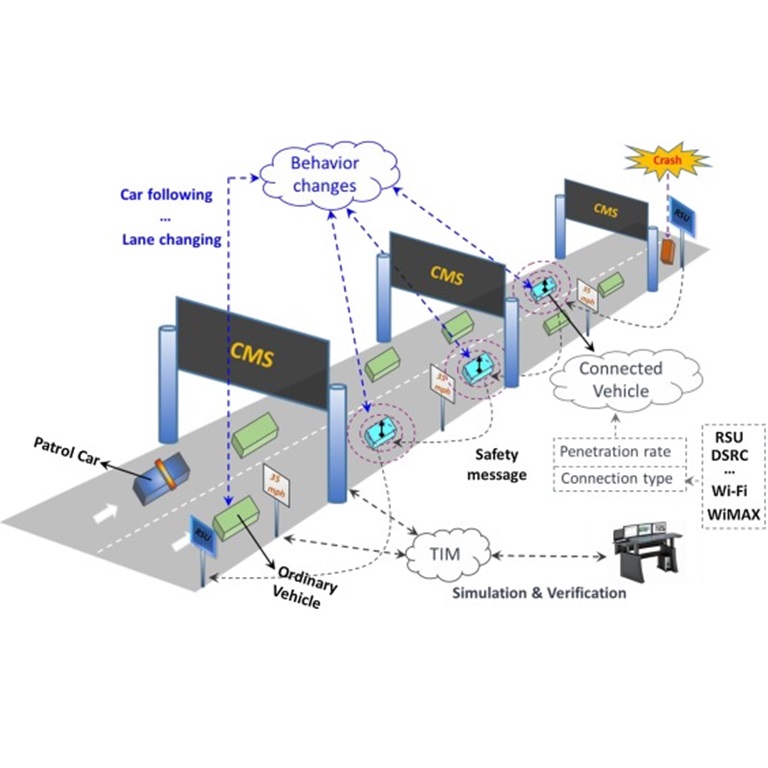
Can Connected Vehicles (CVs) Help Reduce Secondary Crashes?
Source: H. Yang, Z. Wang, and K. Xie (2017). Impact of Connected Vehicles on Mitigating Secondary Crash Risk. International Journal of Transportation Science and Technology, Vol. 6, Issue 3, September 2017, pp. 196-207, DOI: 10.1016/j.ijtst.2017.07.007.
Abstract : Reducing the risk of secondary crashes is a key goal for effective traffic incident management. However, only few countermeasures have been established in practices to achieve the goal. This is mainly due to the stochastic nature of both primary and secondary crashes. Given the emerging connected vehicle (CV) technologies, it is highly likely that CVs will soon be able to communicate with each other through the ad-hoc wireless vehicular network. Information sharing among vehicles is deemed to change traffic operations and allow motorists for more proactive actions. Motorists who receive safety messages can be motivated to approach queues and incident sites with more caution. As a result of the improved situational awareness, the risk of secondary crashes is expected to be reduced. To examine whether this expectation is achievable or not, this study aims to assess the impact of connectivity on the risk of secondary crashes. A simulation-based modeling framework that enables vehicle-to-vehicle communication module was developed. Since crashes cannot be directly simulated in micro-simulation, the use of surrogate safety measures was proposed to capture vehicular conflicts as a proxy for secondary crash risk upstream of a primary crash site. An experimental study was conducted based on the developed simulation modeling framework. The results show that the use of connected vehicles can be a viable way to reduce the risk of secondary crashes. Their impact is expected to change with an increasing market penetration of connected vehicles.